Air Quality & Meteorology, 1975
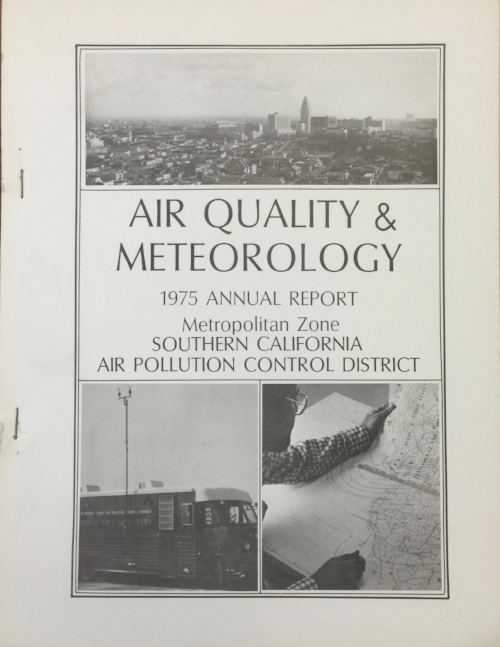
Would a mobile lab, isobars and the city skyline persuade you that air pollution control worked? Image Source: Southern California Air Pollution Control District, Air Quality and Meteorology: 1975 Annual Report (Box 47, Collection 1675: “South Coast Air Quality Management District Records, ca. 1955-1983,” Archives and Special Collections, University of California, Los Angeles).
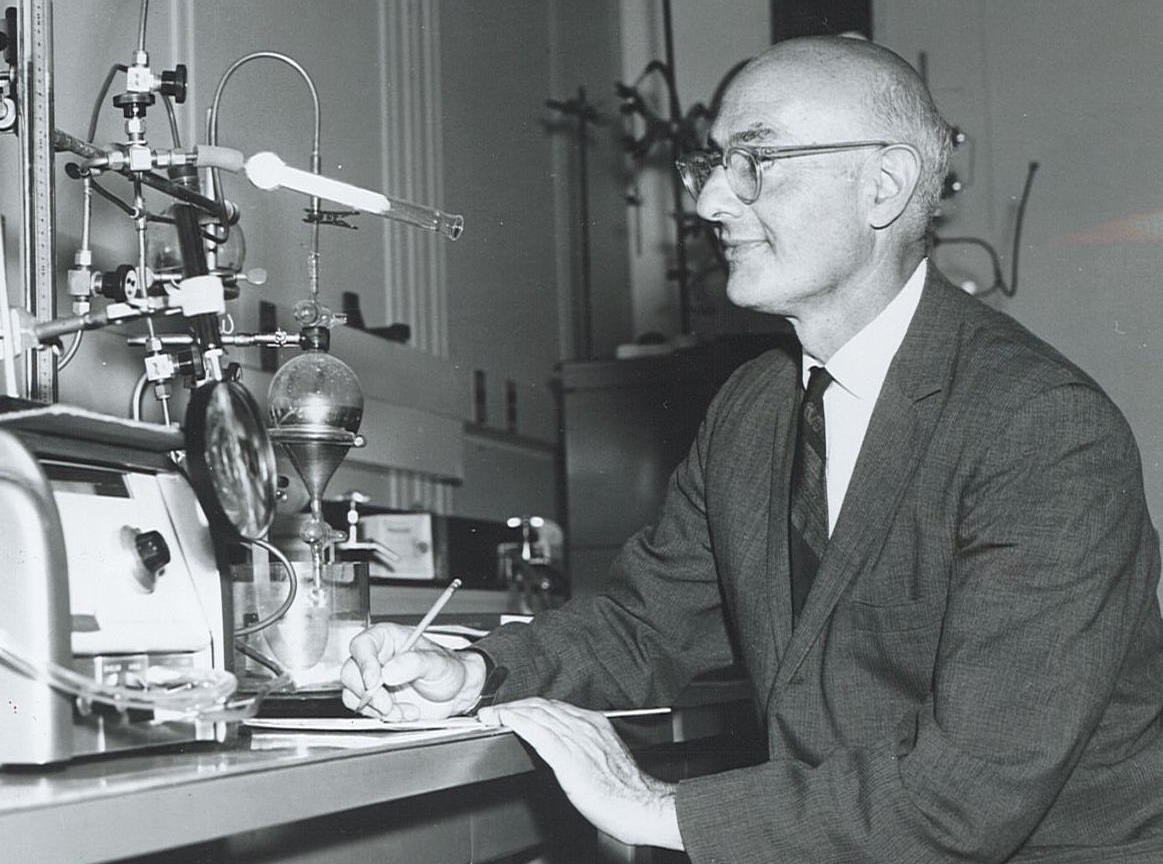
Everybody knows about TV weathercasters who communicate forecasts to the general public, but many (perhaps most) meteorologists work to produce specialized observations and forecasts for niche applications, like agriculture, energy production, or air pollution. Air pollution forecasts help city managers to protect public health, as well as reduce the unsightly smog that makes places unappealing to live and work. When meteorologists forecast the confluence of conditions likely to cause dangerous levels of pollution to linger over a city, authorities can warn vulnerable groups of people to avoid strenuous outdoor activity, or take more assertive steps like closing schools, and limiting certain kinds of driving or industrial activity.
The Los Angeles Air Pollution Control District was a leader in developing the data and techniques that became central to air pollution forecasting. This cover from a 1975 annual summary highlighted three aspects of the district’s meteorological work. The mobile air laboratory at bottom left suggests their geographical reach and ability to respond to changing conditions. The man examining the isobaric chart implies the agency’s close attention to meteorological conditions around Southern California, while the picture of downtown Los Angeles suggests the success the District had achieved in improving visibility and reducing smog.
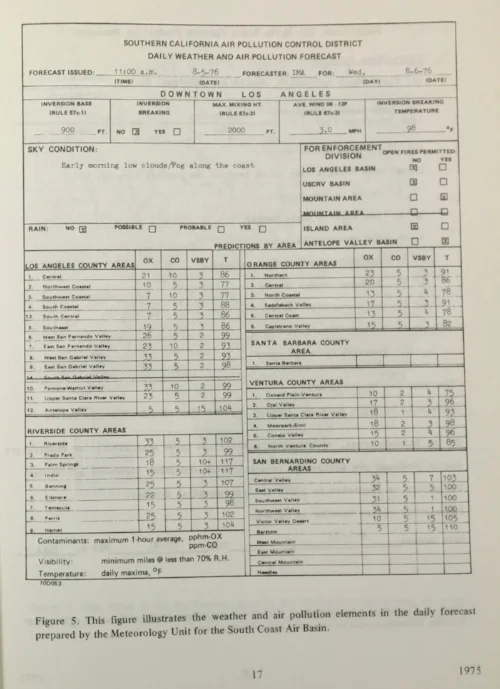
A sample forecast reprinted inside the annual report.
A typical forecast included predictions for levels of oxidants, carbon monoxide, visibility, and temperature for a range of localities across the Los Angeles basin region and surrounding region. Oxidants were forecast as numbers of parts per hundred million, CO as parts per million, visibility in numbers of miles, given less than 70% relative humidity, and temperatures in degrees Fahrenheit.
Here’s what it took to make that forecast. Data came from an extensive network of observing stations across the LA basin: 32 stations run directly by the APCD, plus data shared from 11 more cooperating stations. The Meteorology Unit made hourly observations of the visibility and cloud cover. They received upper air soundings from four airports the LA region, including Edwards Air Force Base, though the Air Force and one recreational airport didn’t report on weekends. According the annual report, “Data from this network are used to trace movements of polluted air masses in the greater Los Angeles area and to determine contaminant source areas.”
In deciding whether an emergency smog warning needed to be issued, the forecasters took into account numerous technical factors: the morning inversion height, the inversion breaking temperature, maximum mixing height, average morning wind speed, maximum temperatures, sky conditions and rain probability.
The public could hear routine air pollution forecasts, as well as special “Air Pollution Episode forecasts” during dangerous periods, by dialing (213) 687-9563. I called this number in November 2016. It’s no longer in service, but AT&T offered to connect me to similar businesses, suggesting companies in shredding or copier repair. Such is the fate of old forecasts.
Learn More:
- M. Z. Jacobson, Atmospheric Pollution: History, Science and Regulation (Cambridge University Press, 2002).
- Peter Brimblecombe, “Deciphering the Chemistry of Los Angeles Smog, 1945–1995,” in Toxic Airs: Body, Place and Planet in Historical Perspective (University of Pittsburgh Press, 2014): pp. 95-108.
Image Source:
Southern California Air Pollution Control District, Air Quality and Meteorology: 1975 Annual Report (Box 47, Collection 1675: “South Coast Air Quality Management District Records, ca. 1955-1983,” Archives and Special Collections, University of California, Los Angeles).